National Study Abroad Day, February 22nd, 2021
In celebration of the second annual National Study Abroad Day, Via TRM is sharing data from our forthcoming 2021 Market Report. Each year, the industry-first Market Report visualizes student data from tens of thousands of users from within our software to share insights and trends related to study abroad.
Many U.S. colleges & universities are preparing to tentatively ramp back up for study abroad, although the landscape of educational travel looks drastically different than it did just one year ago.
As international educators prepare for the future of student travel, we looked to our Program Matching & Traveler Intake data to ask:
- Are college students still interested in studying abroad?
- What countries are the top desired destinations for students?
- What types of programs are students interested in? Is there a demand for virtual programs?
- How certain are students that they still want to go abroad?
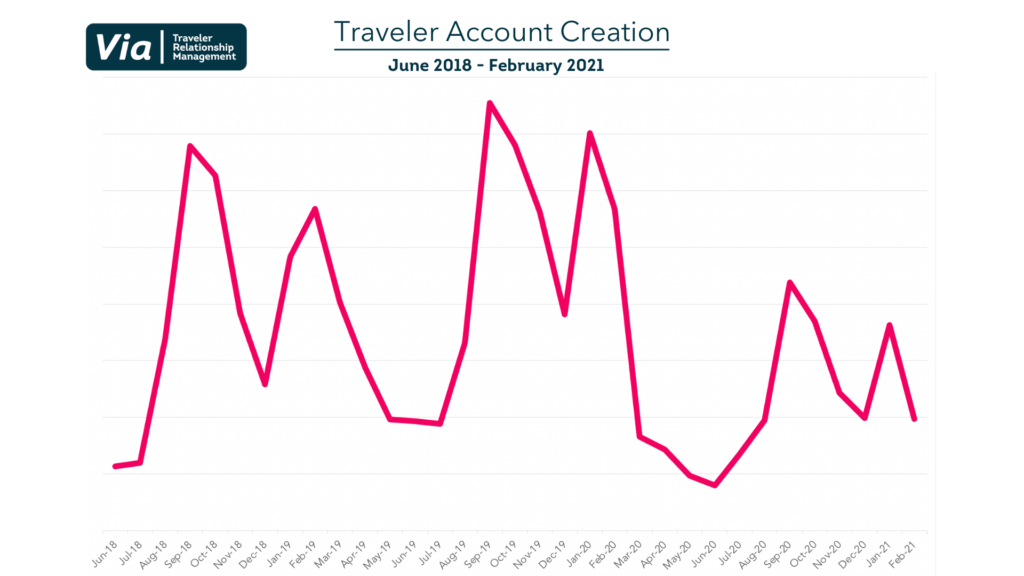
Data snapshot: Between 50,000 – 100,000 travelers represented
The Traveler Account Creation graph shows aggregated data from when students first log in to their campus’ Via Global account to search for and apply to global opportunities. While overall account creation saw a decrease in 2020, students still created new accounts over the course of the year and the trend of students logging in for the first time in September and January remained consistent.
Questions to consider:
- According to this data above, National Study Abroad Day falls during the second peak of student program exploration. In this moment, in what ways can international educators meet this interest and nurture it for future participation?
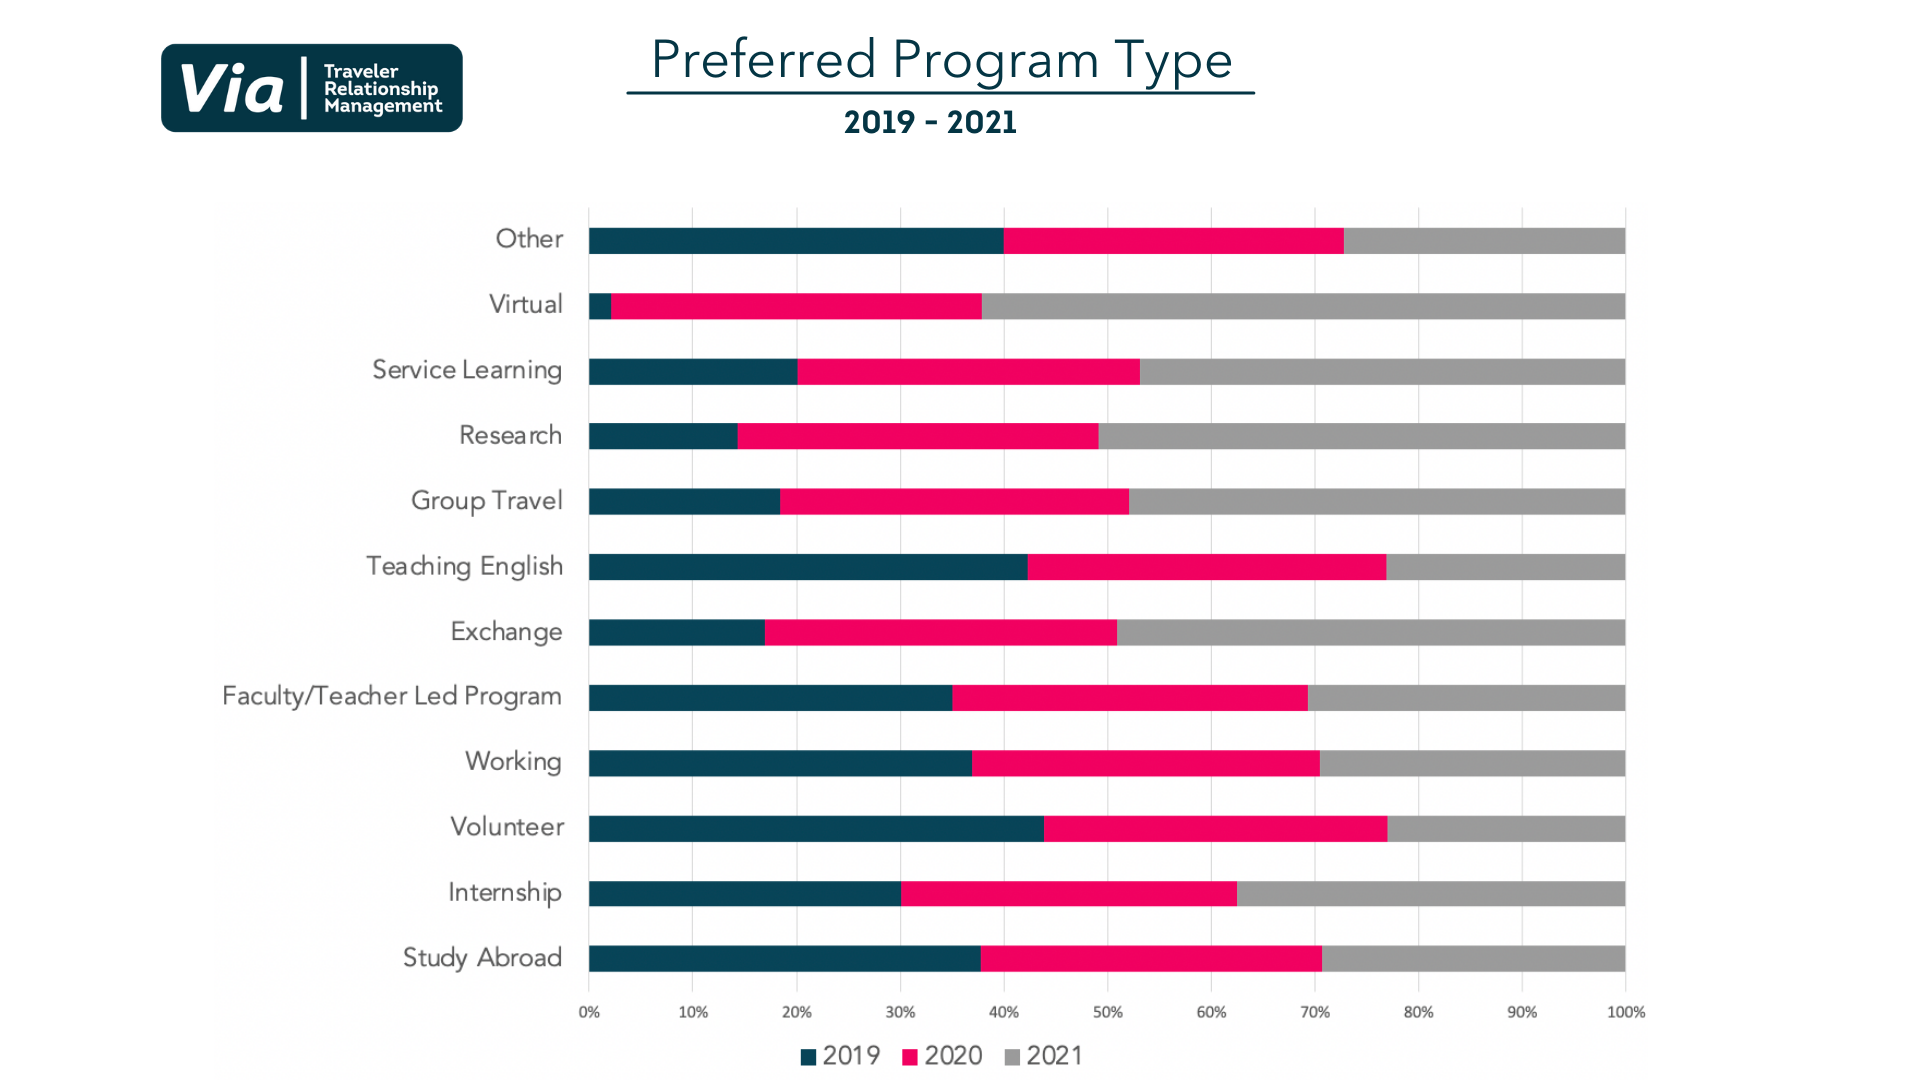
Data snapshot: Between 25,000 – 50,000 answers represented
The Preferred Program Type visual displays the types of programs students are interested in as a percentage of the total number of students who answered the question in the Traveler Intake in the years 2019, 2020, and 2021. While ‘Study Abroad’ remained consistent over the course of the past three years, categories such as ‘Virtual’, ‘Research’, and ‘Group Travel’ all saw an increase in interest.
Questions to consider:
- What could the increase in ‘Group Travel’ or ‘Research’ be attributed to?
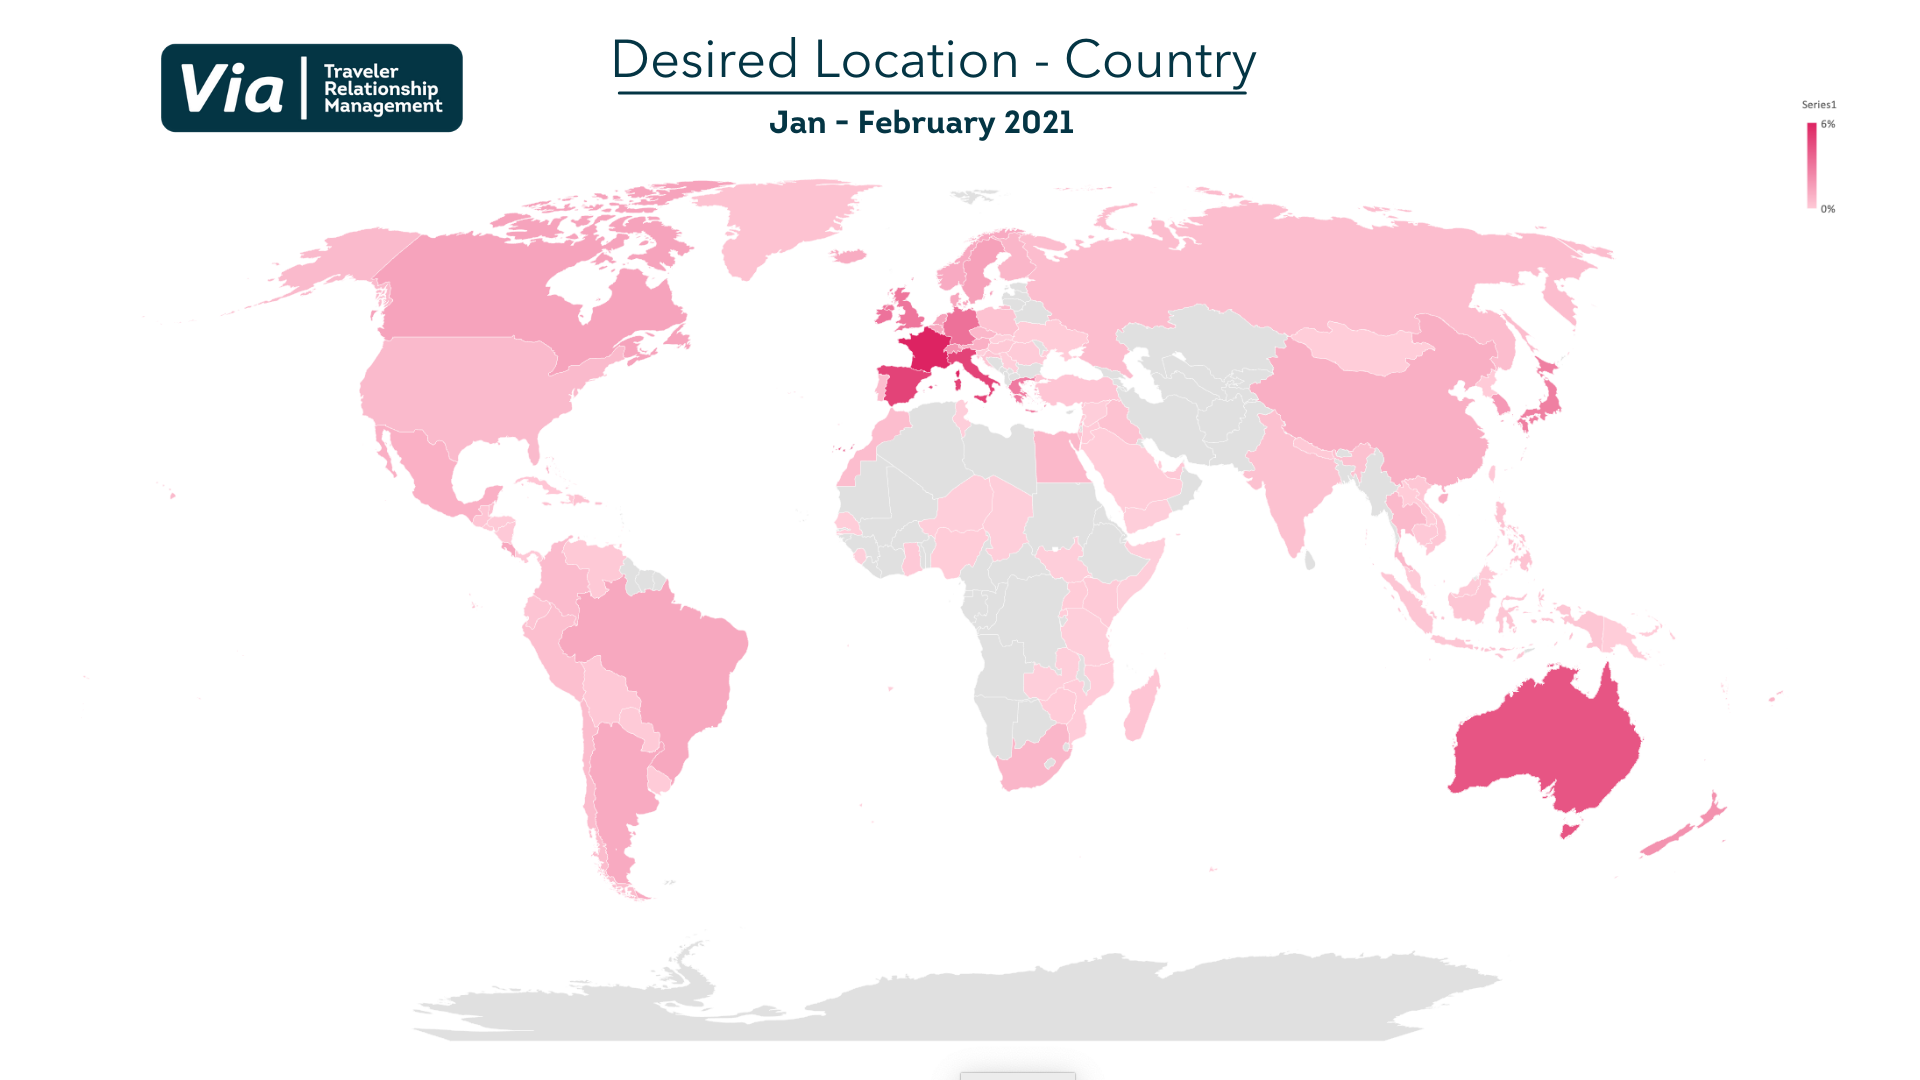
Data snapshot: Between 2,000 – 2,500 answers represented
The Desired Location map visual shows the answers to the Traveler Intake question “Where do you want to go?” as captured from January – February 19, 2021 .
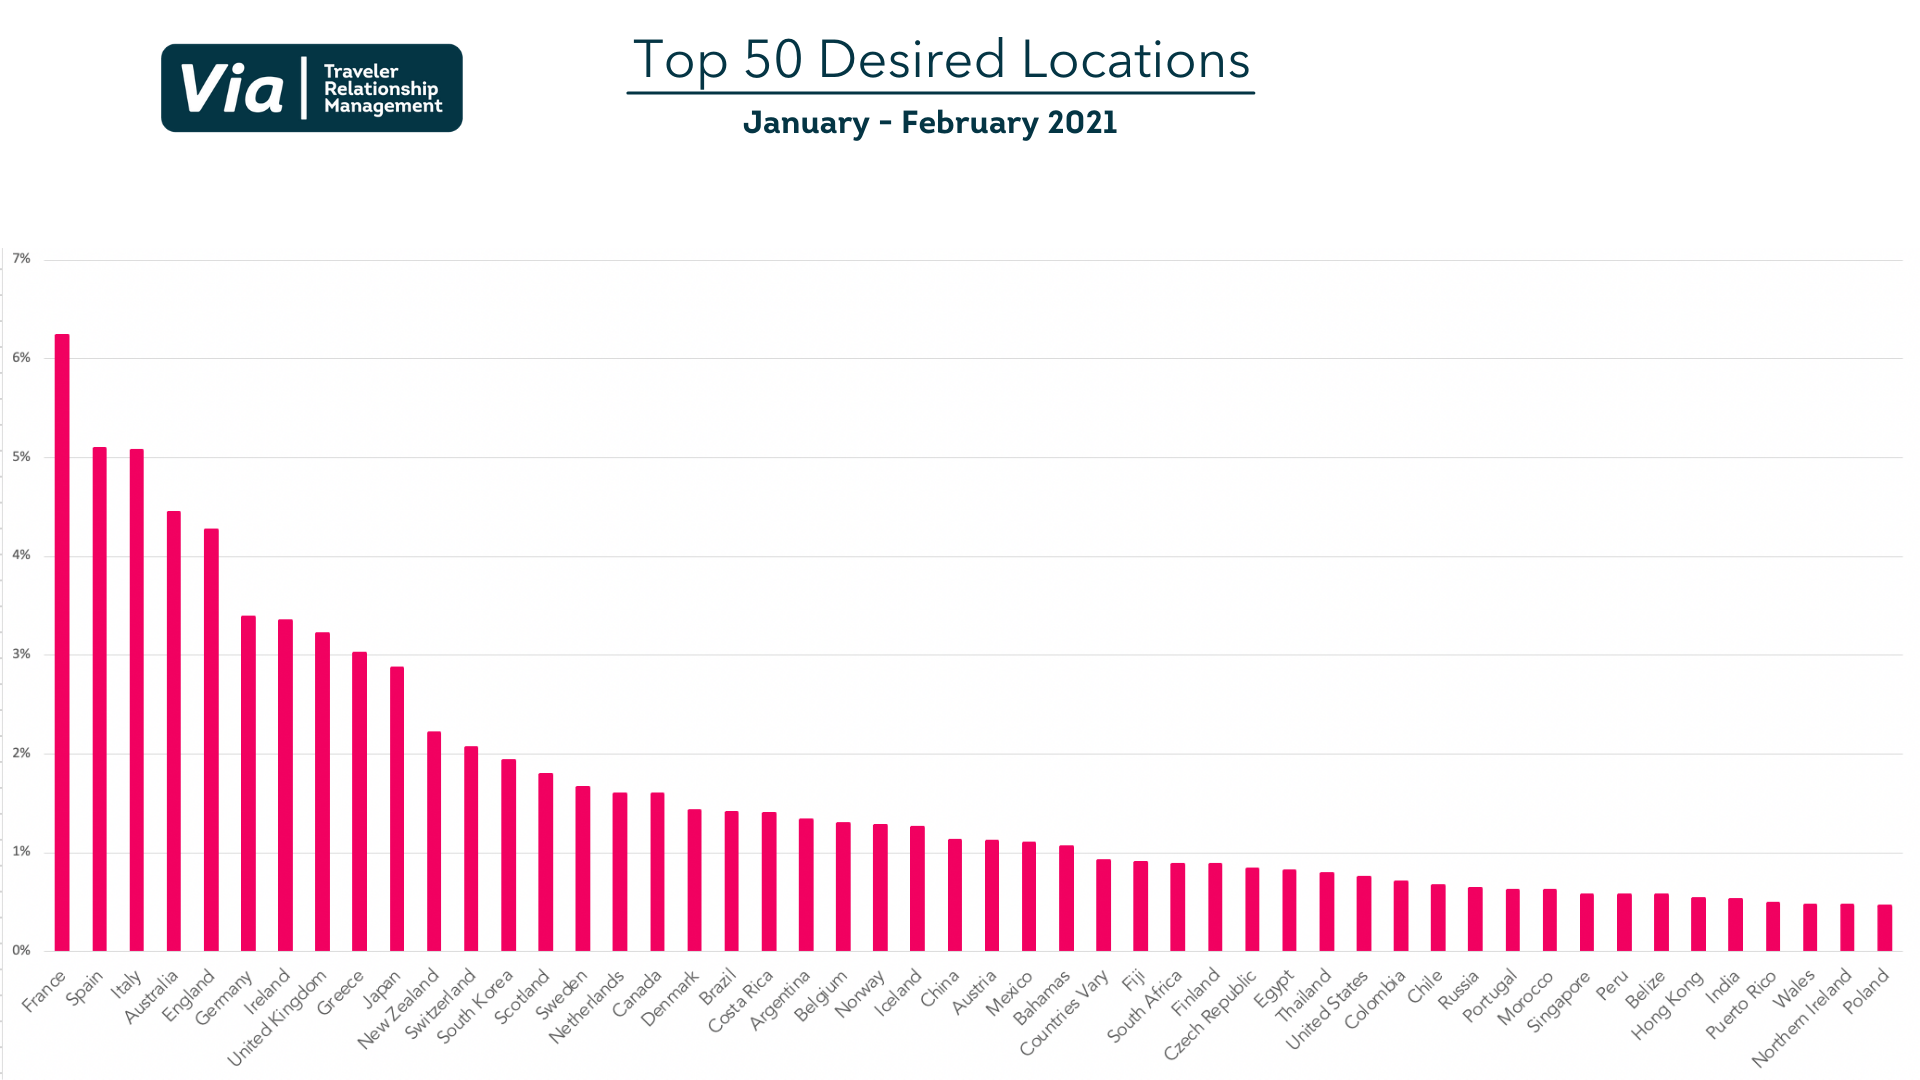
Data snapshot: Between 2,000 – 2,500 answers represented
The Top 50 Desired Locations is a peak into the countries that are capturing the most student interest in the Traveler Intake from January – February 19, 2021.
Questions to consider:
- Are they any countries on this list that don’t often show up on the Open Doors list of top destinations?
Data snapshot: Between 50,000 – 100,000 travelers represented
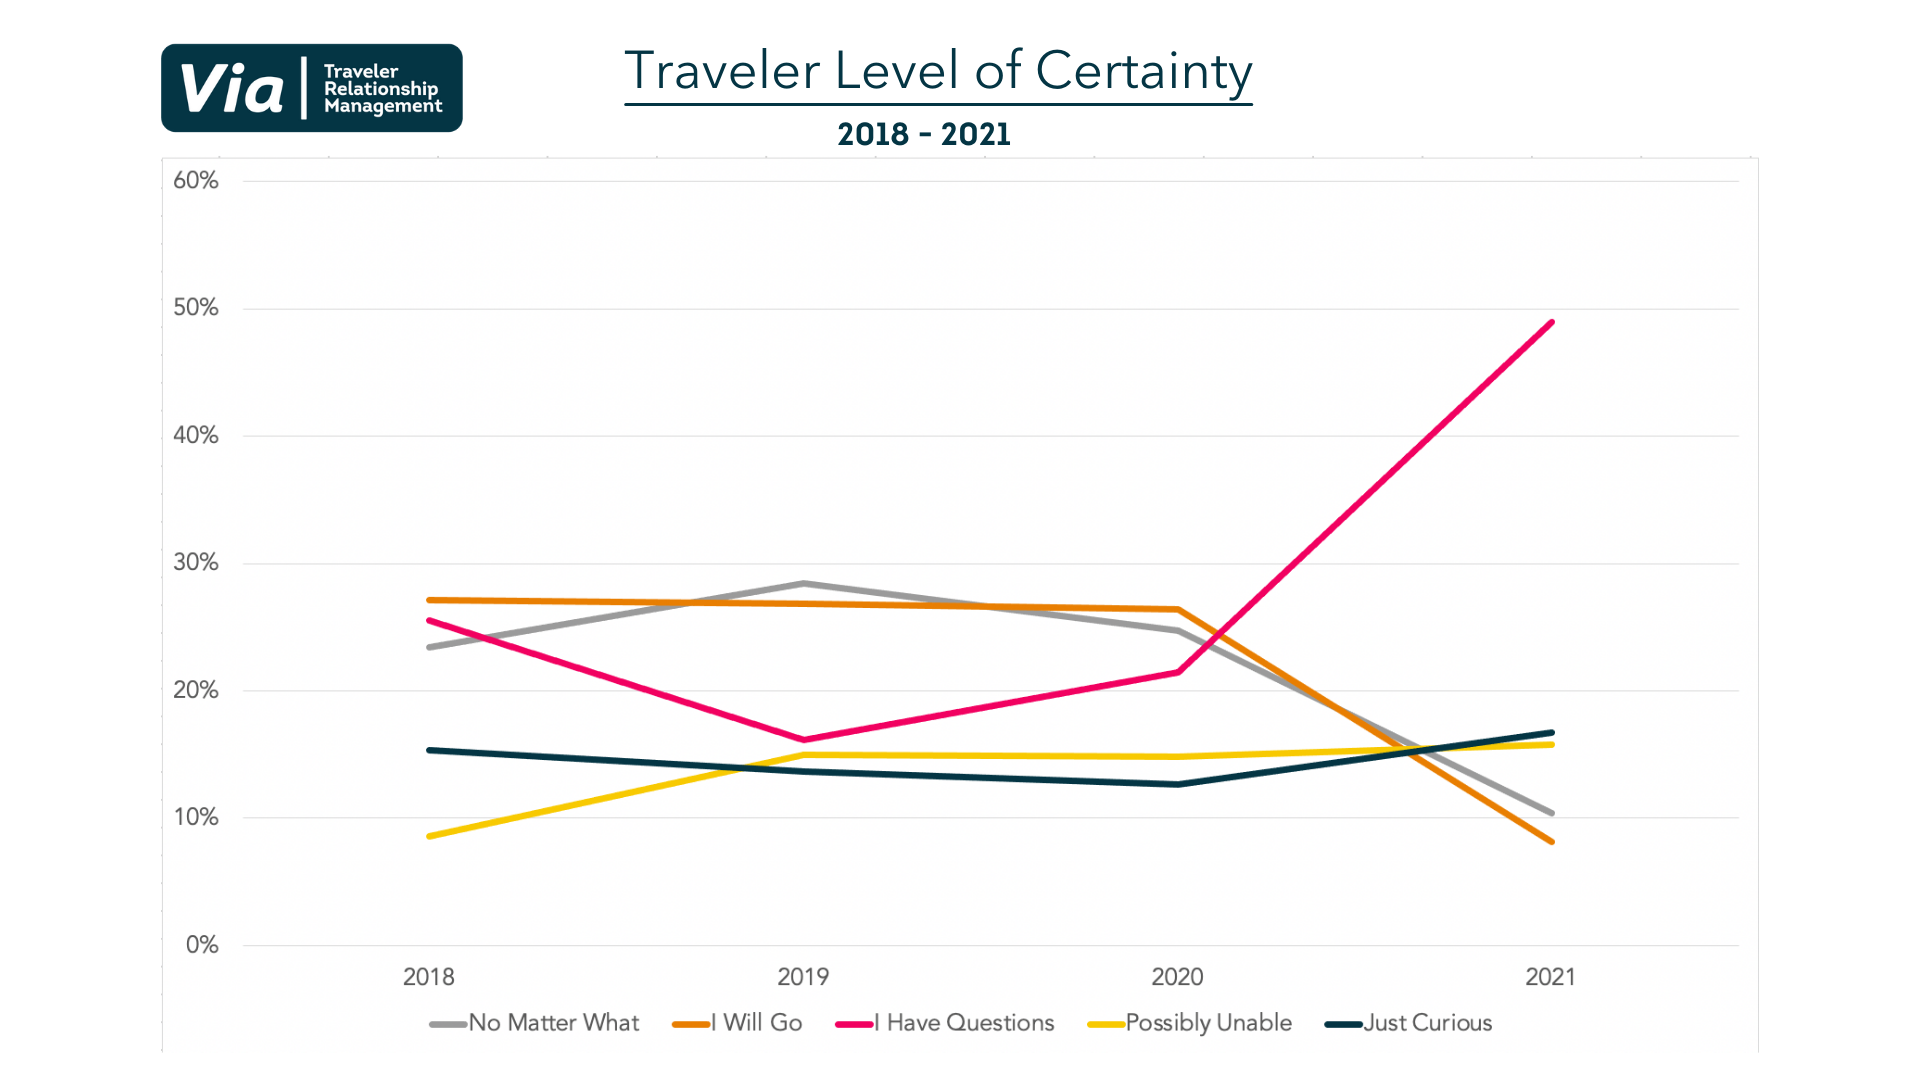
The Traveler Level of Certainty graph visualizes students’ response to the question, “How Certain Are You That You Will Go Abroad?” during 2018, 2019, 2020, and 202. While students who were positive that they would go abroad (“I Will Go”), saw an understandable decrease starting in 2020, the number of students who responded “I have questions” saw a dramatic increase.
Questions to consider:
- What types of questions do students have today that they didn’t a year ago?
- How can international educators support this increase in questions at scale?
Want to make data-driven decisions in 2021? Get on the list to be the first to access the 2021 Via TRM Market Report.