

Via Global





.png?width=40&name=Website%20GRAPHICS%20(1).png)


.svg)



The same measure, on the same students, moves more than fivefold depending on nothing but how long you watch. Not different students. Not a different institution. One cohort, three observation windows, three answers.
If your office reports a conversion rate calculated on the academic year, the number is not a slightly conservative version of the truth. It is a different measurement, and it is not comparable to the one you reported last year unless you controlled for something most offices do not control for.
This piece explains why that happens, and gives you the method that fixes it.
What's in this post
-
Why does the same cohort produce two different conversion rates?
-
Can you benchmark your conversion rate against another institution?
What is a study abroad conversion rate?
A study abroad conversion rate is the share of students who move from an early signal of interest, usually creating an account or starting an application, to a recorded commitment to a program.
That definition sounds settled. It is not, and almost every problem in this post comes from the two decisions buried inside it: where you start counting, and how long you wait before you stop.
The Via 2026 Market Report followed 20,191 students individually, each for at least twelve months, from account creation forward. It also looked at 184,897 applications across more than 200 institutions in a single academic year. Those are two different measurements of the same platform, and they disagree with each other in ways that matter for anyone reporting a number to a provost.
Why does the same cohort produce two different conversion rates?
Because a shorter observation window mechanically removes slow students from the calculation.
Follow a defined group of students for a full year each and 48.3% reach a recorded commitment. That figure comes from the Student Lifecycle Clock: 20,191 students, each observed for at least twelve months.
Now here is the part that matters more than any single number. The report does not publish an academic-year equivalent of that 48.3%, and the reason is deliberate. An academic-year window closes while many journeys are still underway, so it cannot show the same share through to an outcome at all.
That is a stronger claim than "your number is too low." Your academic-year conversion rate is not a conservative version of your real one. It is a measurement of a different thing, and the two cannot be placed side by side.
The scale of the problem is easy to miss: at least 63.9% of the students active during 2025 to 2026 created their accounts before that academic year began. A single-year view therefore begins most stories in the middle. It counts the ending of one group and the beginning of another, and reports the mixture as a rate.
The same measure, three observation designs
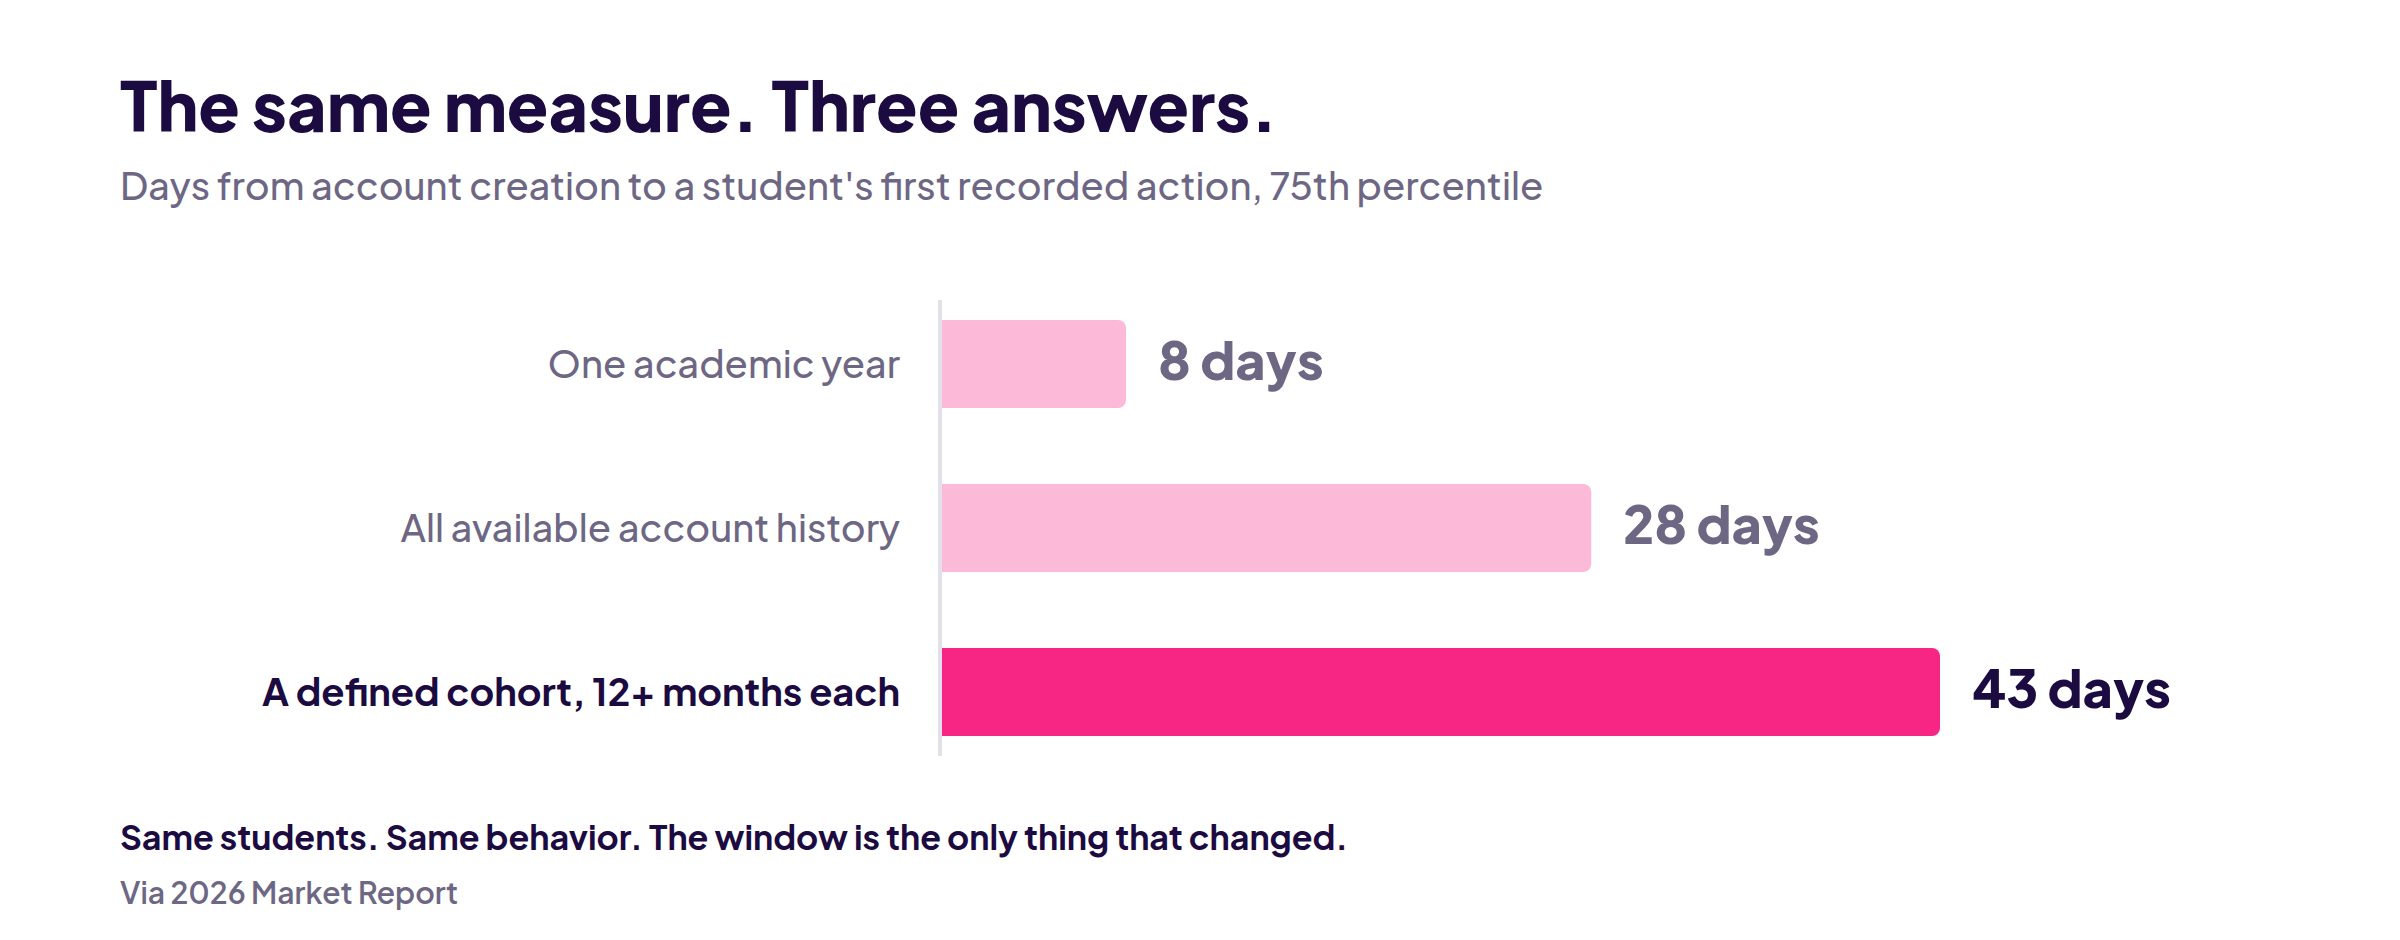
Time from account creation to a student's first recorded action, at the 75th percentile, measured three ways:
|
Observation design |
75th percentile |
|---|---|
|
One academic year |
8 days |
|
All available account history |
28 days |
|
A defined cohort, 12+ months each |
43 days |
The same measure moves more than fivefold. A study that watches students for ninety days cannot record an action taken on day two hundred. Slow students do not become faster in a shorter analysis. They disappear from it, and every timing estimate drifts toward the students who moved quickly.
The artifact that looks like improvement
This one is worth checking in your own reporting this week, because it produces a number that looks like good news.
Group students by the month they created an account and measure apparent dormancy, and the rate appears to fall from 39.4% in July 2025 to 3.0% in June 2026. That reads as a dramatic operational win.
It is not a win. It is an artifact. A newly created account has not existed long enough to meet a thirty-day definition of dormancy. Restricted to cohorts with equal time to act, there is no consistent trend in delayed activation at all.
The rule underneath all three examples: a timing measure is only interpretable when every group in it has had the same amount of time to move.
How long should you observe students before measuring conversion?
Twelve months per student, minimum, with every cohort given the same window.
That is the standard the report uses, and it is the one we would recommend to any office building an internal measure. It is long enough to capture the slow tail, which is substantial: 22.1% of students waited at least thirty days before taking any action, and 1,832 of them waited at least six months. Many of those students went on to commit.
An office that writes off a slow starter at week two is writing off a population that converts.
The practical version of this rule has three parts:
- Anchor on the student, not the calendar. Start the clock when a student creates an account, not when the fiscal or academic year opens.
- Give every cohort the same runway. Never compare a September cohort with twelve months of history to a March cohort with four.
- Report the window alongside the rate. "48.3% at twelve months" is a usable number. "48.3%" on its own is a number somebody will misuse in a board deck.
Can you benchmark your study abroad conversion rate against another institution?
Mostly, no. And this is the part of the report we expected to be least popular with our own sales team.
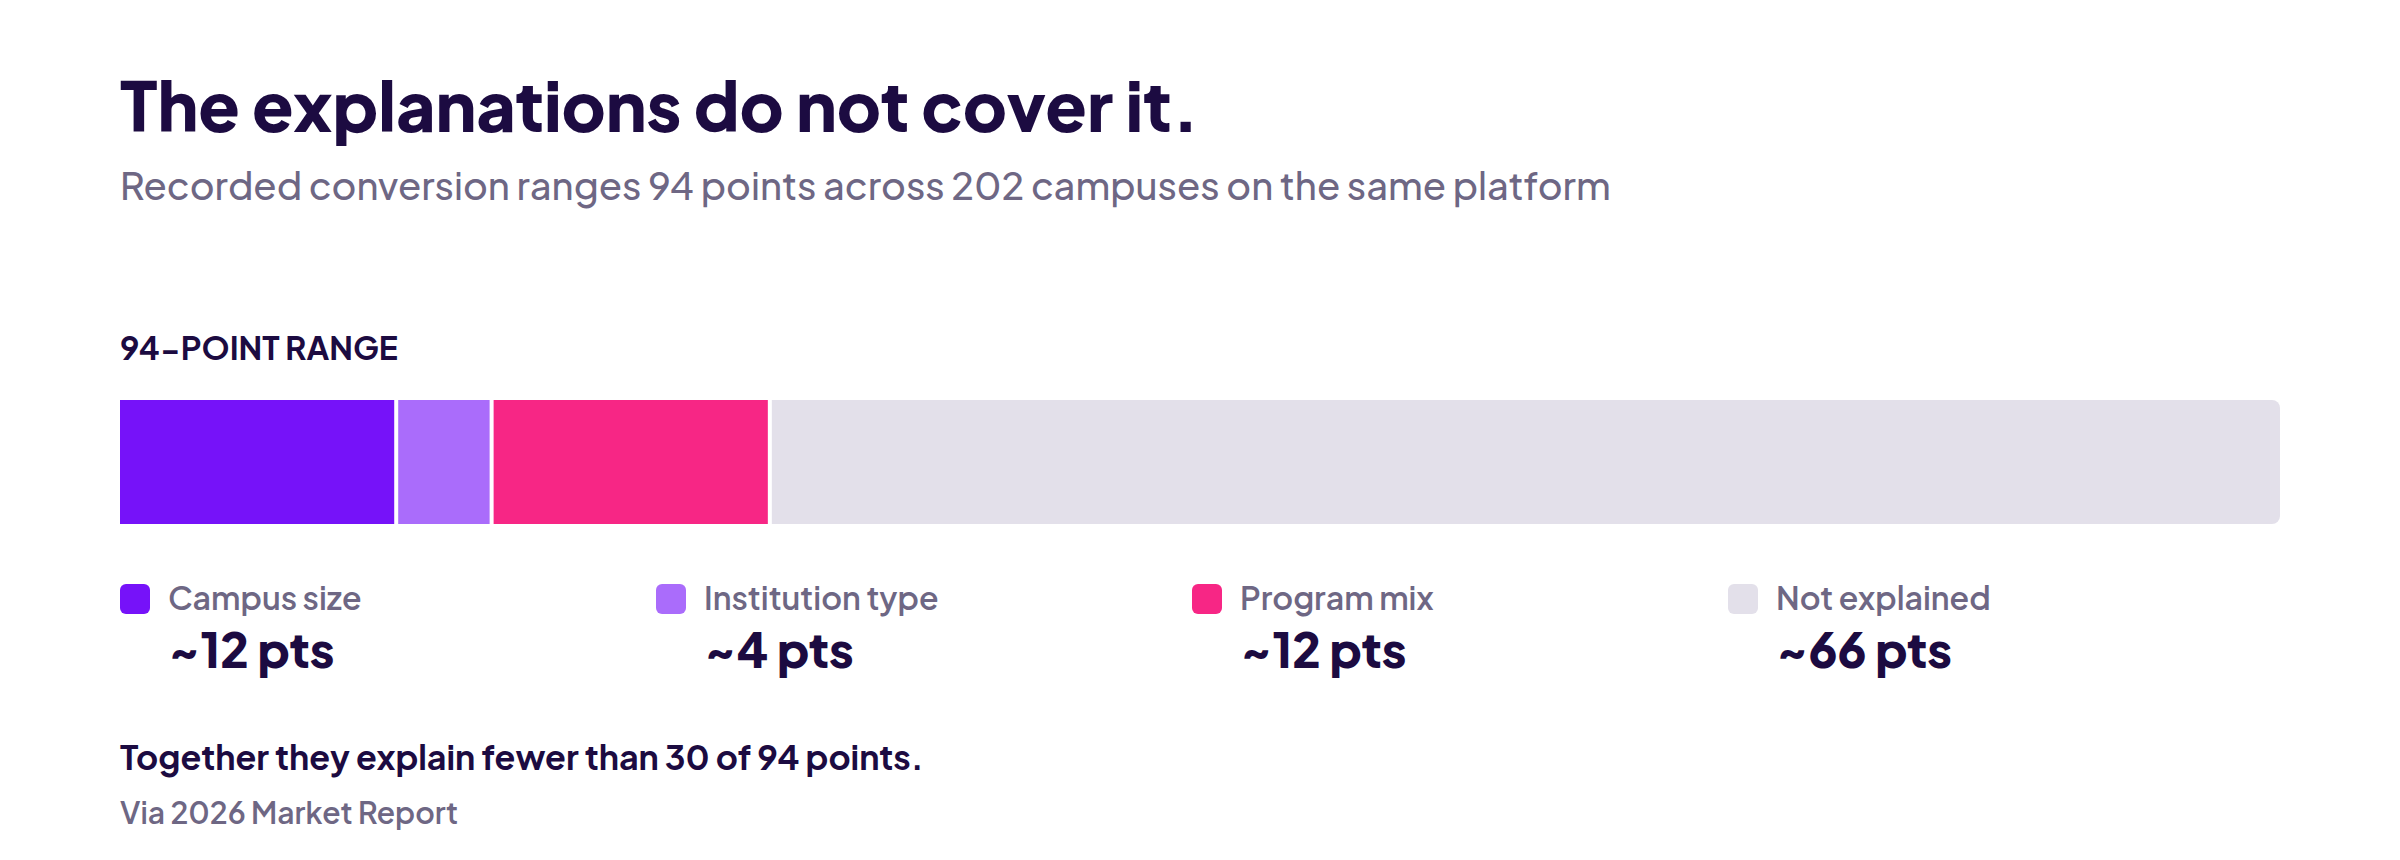
Across 202 campuses running the same platform, recorded conversion ranges from 3.2% to 97.2%. The middle half alone spans roughly 29 points, with quartiles at 29.4%, 44.9%, and 58.7%.
A 94-point range across institutions using identical software should stop anyone who has ever put a peer comparison in a strategic plan.
The explanations do not cover it
We tried to account for the range with the obvious structural factors:
|
Factor |
Explains roughly |
|---|---|
|
Campus size |
12 points |
|
Institution type |
4 points |
|
Program mix |
12 points |
|
Together |
Nowhere near 94 |
Two things are tangled inside what remains, and this dataset cannot separate them.
Practice is real: how programs are curated, how advising is staffed and organized, what happens to a student after they submit. Bookkeeping is also real: when an institution changes a status, and what that institution means by the word commitment.
The proof that bookkeeping is in there
Sixteen institutions in this dataset record more committed applications than submitted ones.
That is not a finding about students. It is arithmetically impossible under a normal sequence, which means statuses are being assigned outside the expected order. Every one of those institutions almost certainly has a sensible local reason for it.
But it demonstrates the point cleanly: a conversion rate calculated at one campus and a conversion rate calculated at another are not reliably measuring the same thing.
The conversion rate looks like a performance measure. In this dataset, it is partly a dictionary.
This is not an argument against measurement. It is an argument against one specific use of it, and it points directly at what does work.
What does a valid internal benchmark look like?
Your own institution, measured against its own history, using definitions you have written down.
That is the whole method, and no software is required to start it. Here is the setup we would recommend to any education abroad office, in the order we would do it.
1. Write down what each status means
Most offices have never documented when a status gets set or who sets it. This takes an afternoon and it is the prerequisite for everything below. Without it, next year's number is not comparable to this year's either, because staff turnover quietly changes the definitions.
2. Fix the cohort, not the calendar
Define a group by account creation month. Follow that group forward. Do not let the academic year decide when you stop looking.
3. Give every cohort twelve months
Compare September 2025 with September 2024, not with March 2026. Equal runway or no comparison.
4. Measure the transitions, not just the endpoint
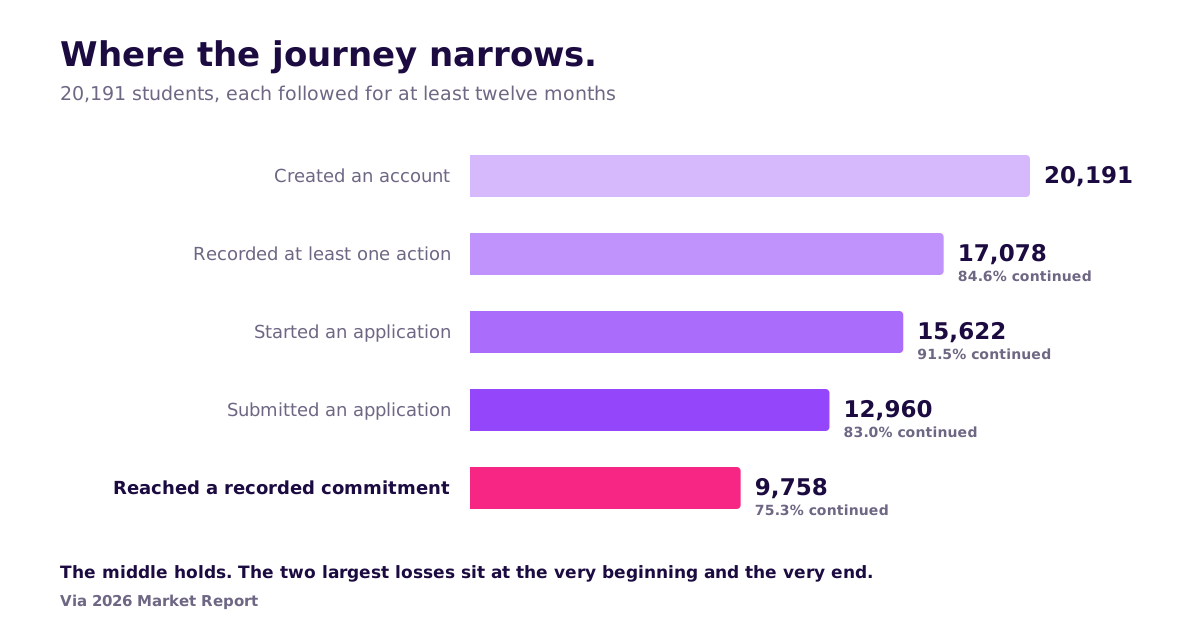
A single conversion rate hides where the loss actually happens. The report's cohort narrowed in four distinct stages:
|
Stage |
Students |
Continued |
|---|---|---|
|
Created an account |
20,191 |
|
|
Recorded at least one action |
17,078 |
84.6% |
|
Started an application |
15,622 |
91.5% |
|
Submitted an application |
12,960 |
83.0% |
|
Reached a recorded commitment |
9,758 |
75.3% |
Notice that the middle holds better than either edge. The two largest losses sit at the very beginning and the very end, and they are completely different advising problems. One group never becomes visible through its behavior at all. The other moves through nearly the entire process and then stops. A single rate treats them identically. A stage view does not.
5. Report the window with the number, every time
Then compare year over year, same definitions, same runway. That comparison can reveal a real change. A platform-wide ranking cannot.
Where this leaves the number in your annual report
If you take one operational change from this piece, make it this: recalculate your conversion rate on a fixed cohort with twelve months of follow-up, and put the observation window in the label.
Most offices that do this find their pipeline is healthier than their academic-year number suggested, and that the students they had written off as lost were mostly students they had stopped watching.
The number itself was never the problem. The clock was.
Sources and further reading
- Via 2026 Market Report: The Untold Story of the Study Abroad Student Journey, Via TRM, August 2026
- Open Doors Report on International Educational Exchange, Institute of International Education. Open Doors reported 298,180 US students studying abroad in 2023 to 2024 and remains the field's participation benchmark.
- The Forum on Education Abroad, research and standards